
Lucrative Analytics
Ask a revenue question and see the evidence behind the answer.
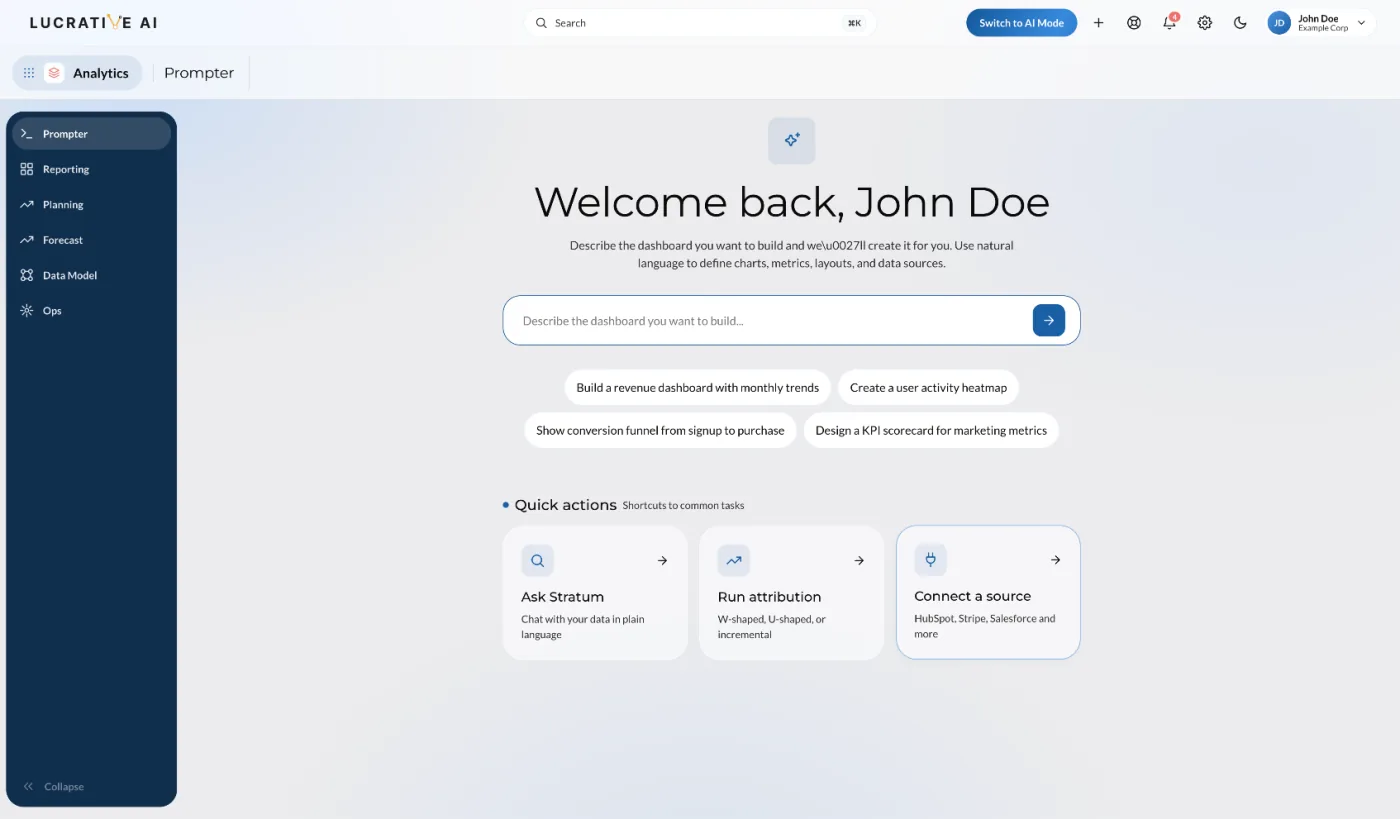
Explore pipeline, attribution, forecast, campaign, and customer performance in plain language. Build repeatable views and trace each result back to its sources and logic.
Use the same customer and revenue model that powers the work.
See what supports the answer.
Review the sources, definitions, model, and confidence used to produce the result.
Lucrative Analytics · 4 connected sources
Founder Story shows stronger enterprise conversion. Review budget and audience quality before the next planning cycle.
Why revenue answers are hard to trust
Data is spread across systems, and the meaning of the metric is often separated from the result.
The answer needs context.
Business questions turn into a queue for the analytics or operations team.
Definitions and relationships differ across systems and reports.
Simple attribution views miss much of the buying journey.
A dashboard shows the number but often hides the cause and supporting evidence.
Every team creates another version of the metric.

• HubSpot Closed-Won Revenue: $188,000
• Overall Blended ROI: 4.42x
Understand the number and the evidence behind it
Lucrative Analytics keeps sources, definitions, models, and confidence with the answer.
Measure the marketing to sales handoff
Connect campaign activity, qualification, sales acceptance, opportunity work, and outcomes. Review which sources produce accounts that Sales accepts and progresses.
Plain language with query visibility
Humanized Data Query lets a user ask in plain language and inspect the generated query. Advanced users can review and adjust the logic when the question requires more control.
Build a dashboard from a defined question
Describe the metric, audience, time period, and comparison. Lucrative prepares the view so the team can review the logic and save it for repeat use.
Compare attribution models with the journey context
Compare attribution approaches and inspect the activities that shaped the journey. Event participation, campaigns, sales acceptance, and opportunity progress can be reviewed in one reporting context.
Review important changes and proposed actions
A weekly brief can explain what changed and prepare possible actions with supporting evidence and confidence. The accountable owner decides what to test or change.
Prove your strategy
Run holdout experiments without SQL. Compare two groups. Measure lift. Validate marketing investments with statistical confidence.
Useful to business teams and analysts
Ask in plain language and inspect the logic when needed.
Visible source and relationship mapping
Map external records to the approved revenue model and keep those relationships visible. Integration requirements and available connections are confirmed for each account.
Two ways to run a Monday.
Compare a reporting queue with a connected question, evidence, and decision workflow.
The old way
Dashboards & tickets
The Lucrative Analytics way
Ask, understand, prove

Bring the required sources into one reporting context
Map the systems, definitions, and ownership behind each measure. Connection availability is confirmed for every account and source.
Analytics by role
One revenue context for four different questions
Marketing, leadership, RevOps, and service providers can use the same governed definitions and evidence.

Connect campaign performance to pipeline evidence
Review which campaigns influenced accepted accounts and pipeline, then inspect the sources and definitions behind the result before changing the plan.
What changes when revenue context is connected
Business teams can ask, inspect, compare, and save the answer in one place.
Ask the question without opening another request.
WHAT LUCRATIVE ANALYTICS ALREADY KNOWS
Use the meaning your business has approved.
CREDITED REVENUE · BY MODEL
Compare models before using the result.
NURTURE SEQUENCE · HOLDOUT
lift · 95% confidence
Test whether the change made a difference.
Turn a defined question into a repeatable view.
Analytics that keeps
the evidence attached.
Ask in plain language, inspect the definitions and query, and save a useful answer for repeat use.
Start with Analytics and the shared revenue workspace.
The Starter plan begins at $90 a month and includes the core revenue products and published allowances.
- 5 user seats included
- 5,000 Marketing Contacts
- 25,000 Verified Emails
- 500 AI Execution Credits
- Conversational Prompter Analytics

FAQs
Questions? Answered